Artículos técnico
Actualizado 02/2022
Synchrophasor Monitoring Applications in Distribution Networks
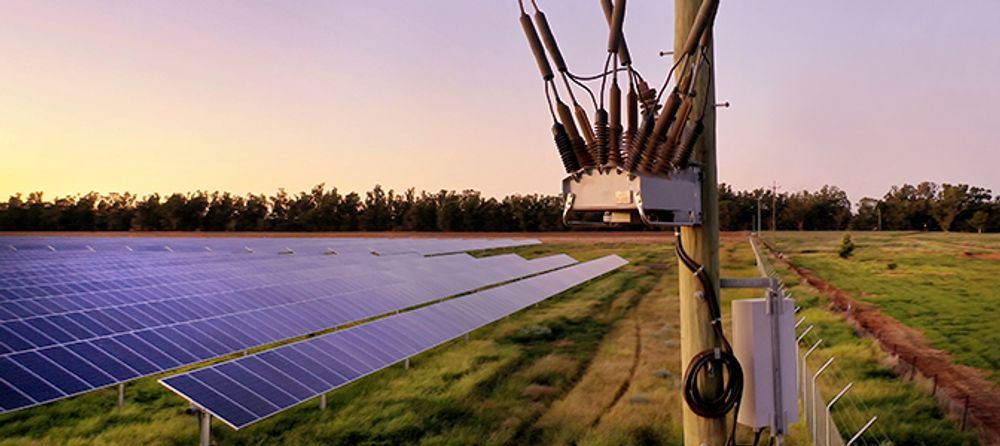
Phasor Measurement Units (PMUs) and Synchrophasor data acquisition represent promising options for rapid, safe and reliable integration and control of renewable energy to the electricity distribution grid. A project to evaluate the benefits of deploying PMU data has been under sponsorship from the Australian Renewable Energy Agency in partnership with NOJA Power, Electricity Utilities and Universities in Australia. The PMU functionality was integrated into NOJA Power Recloser Controllers and deployed at 100 sites throughout Australia. This article explores the technical findings of this first grid scale deployment, demonstrating the value and justification for further adoption of this technology.
Synchrophasor Definition
A synchrophasor is a time-synchronized measurement of power system measurements [1]. Core benefits of synchrophasor data, when compared to conventional measurements, are their higher reporting rate, their GPS synchronized values and phase angle measurements. Synchrophasor data are reported every tens of milliseconds, while traditional systems such as SCADA report once per several seconds.
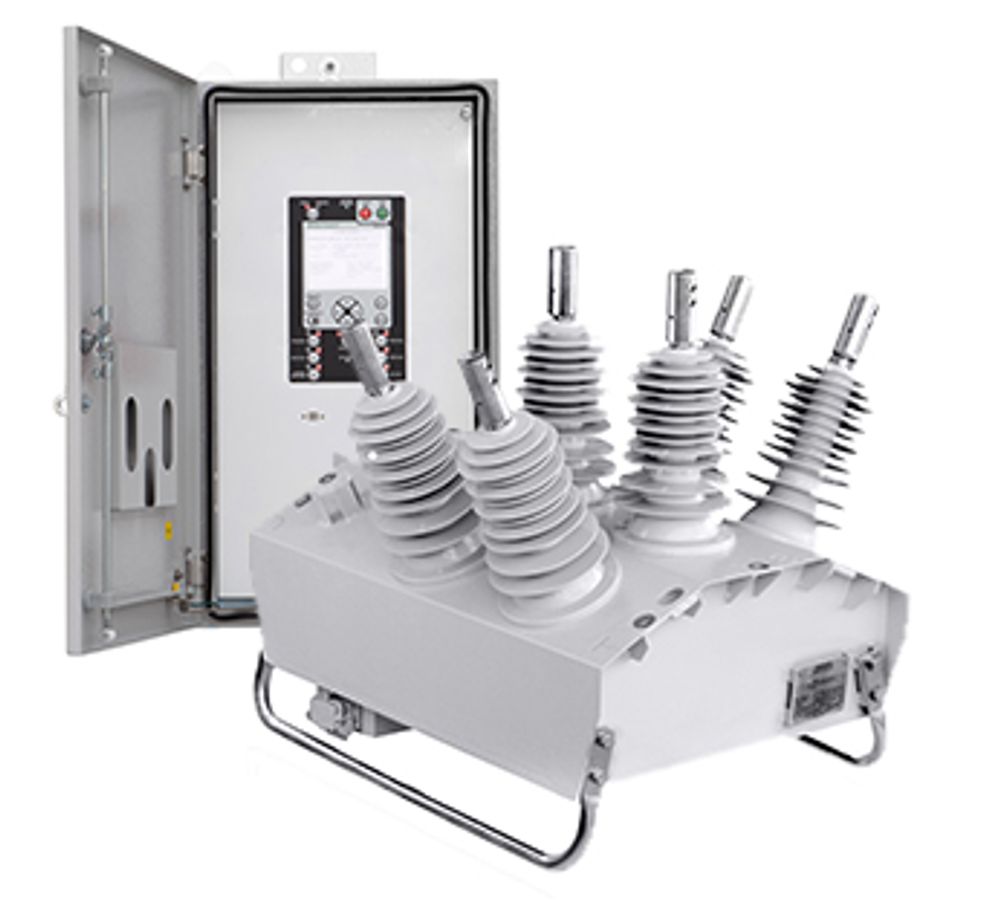
PMUs are a functional or logical device that provides synchrophasor measurements, system frequency and rate of change of frequency estimates [2]. NOJA Power’s RC-20 Recloser Controller is an example of integrated PMU capabilities. A photo of an RC-20 with an outdoor switching module (OSM) is given in Figure 1.
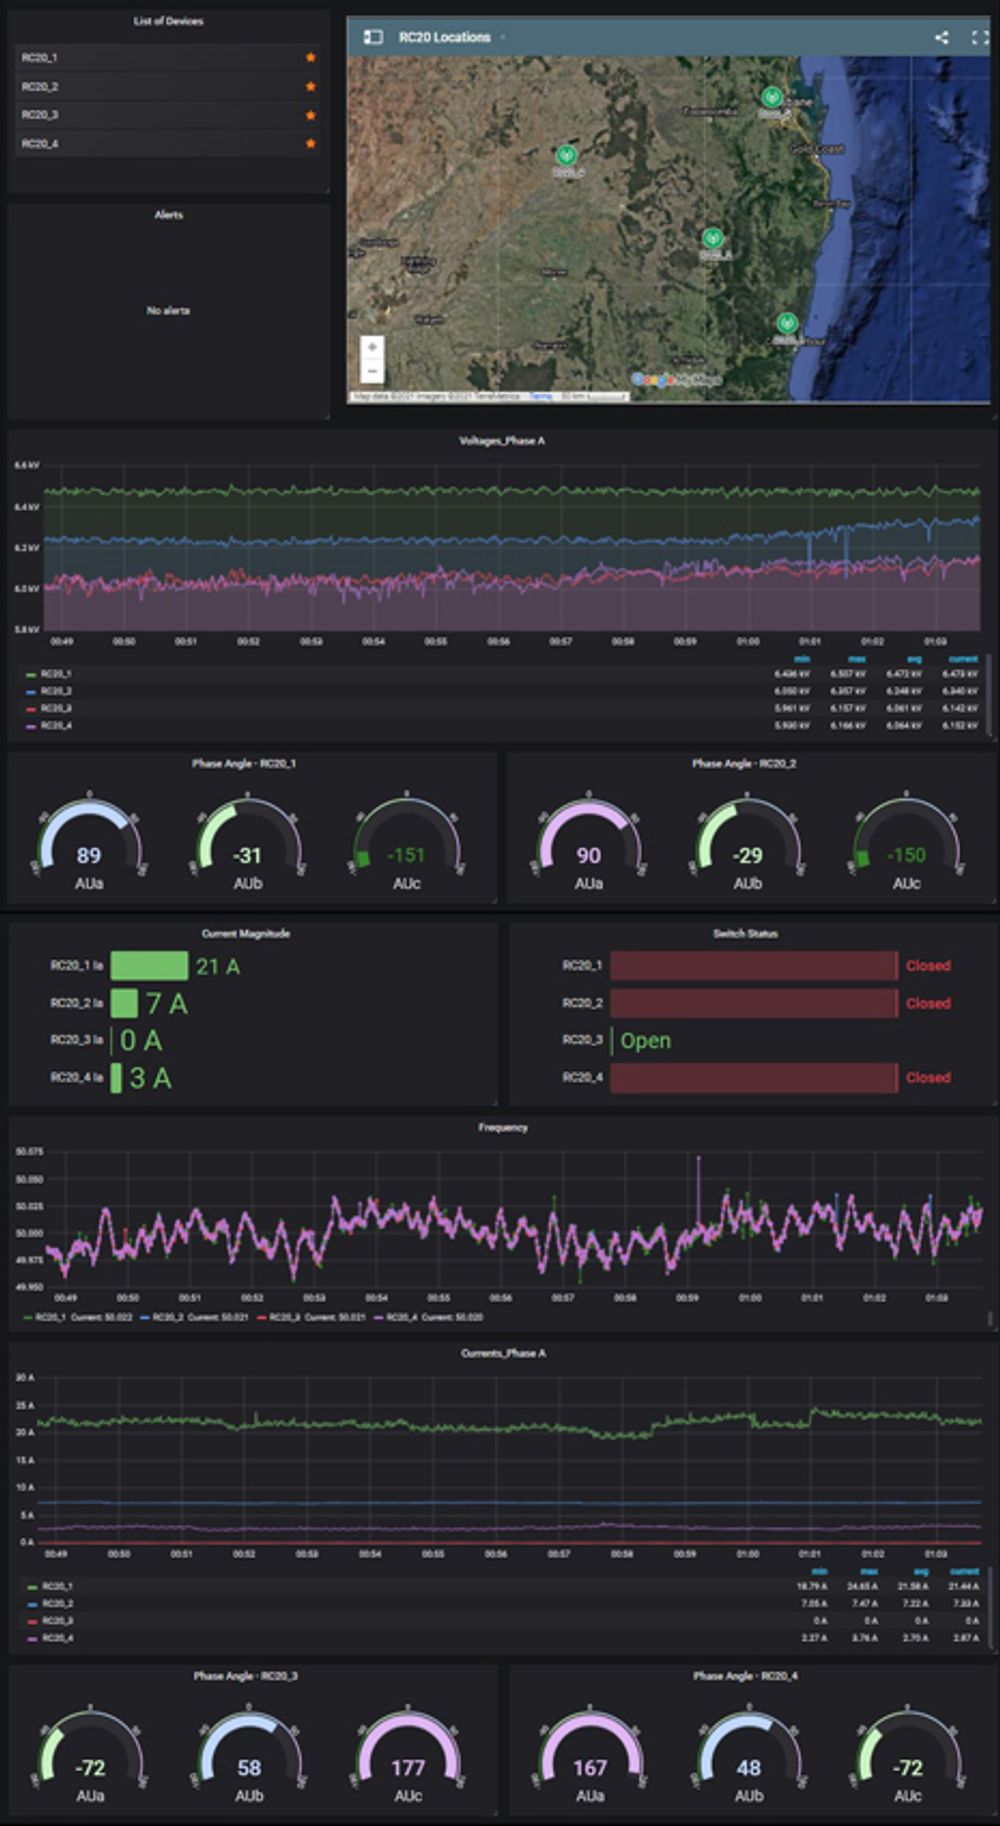
The RC-20’s integrated PMU generates high resolution power system data, improving the visibility and modelling of the power system. Data collected from RC-20s are sent through a secure 4G Virtual Private Network (VPN) to the NOJA Power Analytics platform. Located on a virtual machine, this platform includes a Phasor Data Concentrators (PDC), a visualisation tool and a historian. The NOJA Power PDC aggregates and time-aligns synchrophasor data received from RC-20s across the network. The visualization tool and a data archiving platform are developed to facilitate storage, monitoring and big data analysis.
Synchrophasor Monitoring Applications
Synchrophasors have many monitoring and control applications in the distribution grid [3]. Here we will discuss some of the monitoring applications using real network data collected from installed RC-20s in the Medium Voltage (MV) grid.
“The NOJA Power Cloud Analytics product is a powerful tool for our utility customers to stream, collect, store and analyse big data to ultimately get better vision on their networks to then plan further performance and reliability improvement,” reports NOJA Power Group Managing Director Neil O’Sullivan.
A. Load Characterisation
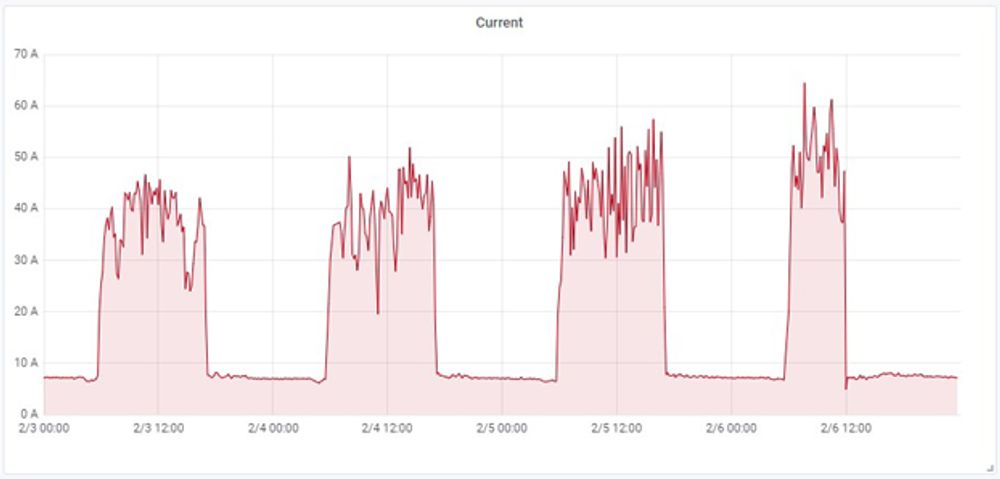
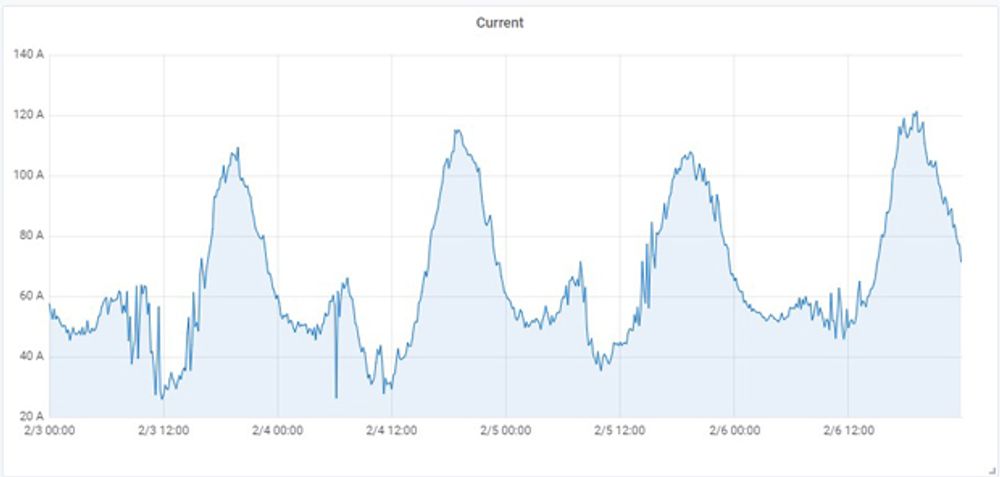
Examining historical data with milli second resolution helps utilities to have a better understanding of the loads connected to their networks. This helps operators to manage their grids in a more reliable and efficient way. Figure 3 and 4 are historical current magnitudes over four days from two different RC-20 connections. It can clearly be seen that the first unit (figure 3) is an industrial load consuming power from morning to the evening while the second load (figure 4) is a residential area with small morning peak and large evening peaks.
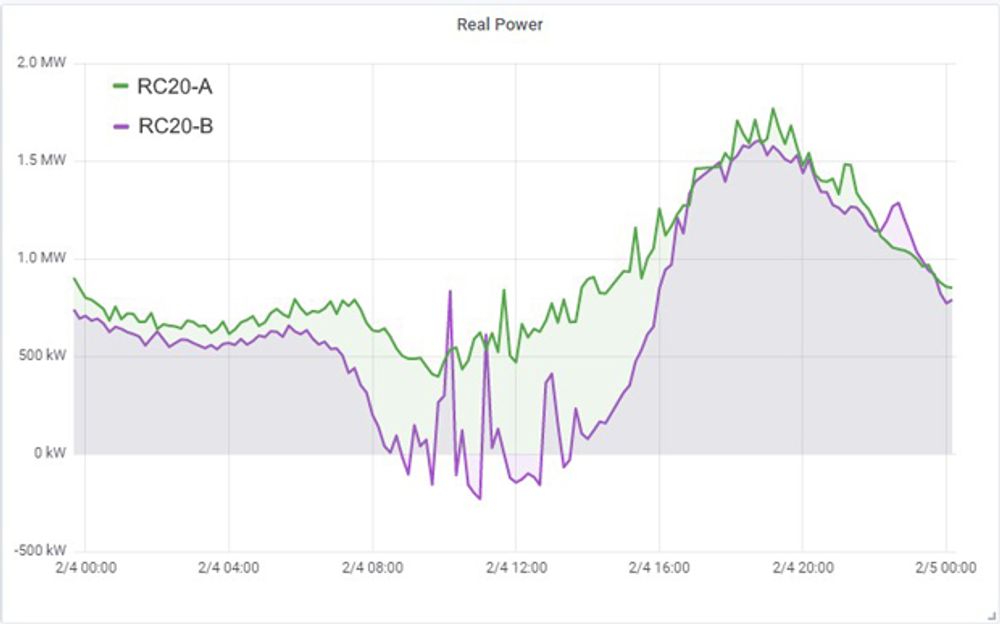
The load characterisation will also help in understanding rooftop solar impact on load and network voltages. Figure 5 illustrates the load shape of two residential areas.
While both areas have similar load profiles in the early morning and the evening, there is a big difference in their power consumptions from 7 am to 5 pm. This shows that the area of RC-20-B has a high level of solar generation (about 500kW) which can cause reverse power flow during noontime.
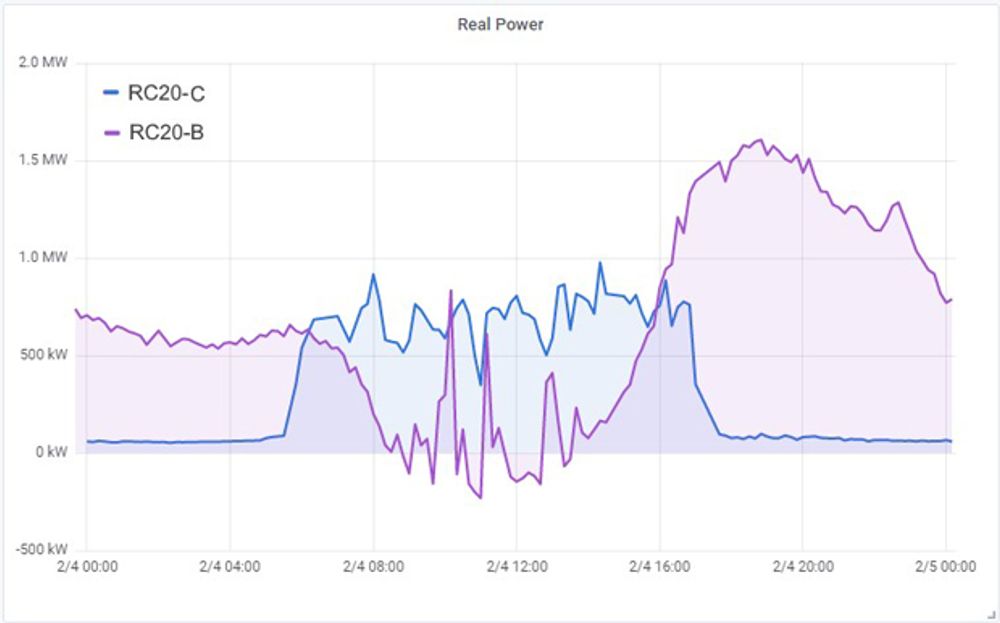
Monitoring synchrophasor data will help utilities to understand their networks better and reduce some of their limits on renewables. By simultaneously monitoring the output of renewables and power consumption of loads on a feeder, utilities have a better understanding of the flow of power on the feeder and allowing more renewable power to be absorbed. Synchrophasors facilitate better-informed system planning and real-time operations for distribution network service providers. For instance, figure 6 shows a great correlation between solar generation at RC-20-B and the power consumption at RC-20-C connection. While the load is low in site B from 7am to 5pm due to the high PV generation from rooftop solar, the industrial load at site C absorb most of its power. Based on these correlations, utilities can reduce restrictions on solar generation at site B to participate in feeding the industrial load in the same area.
B. Distributed Energy Resources
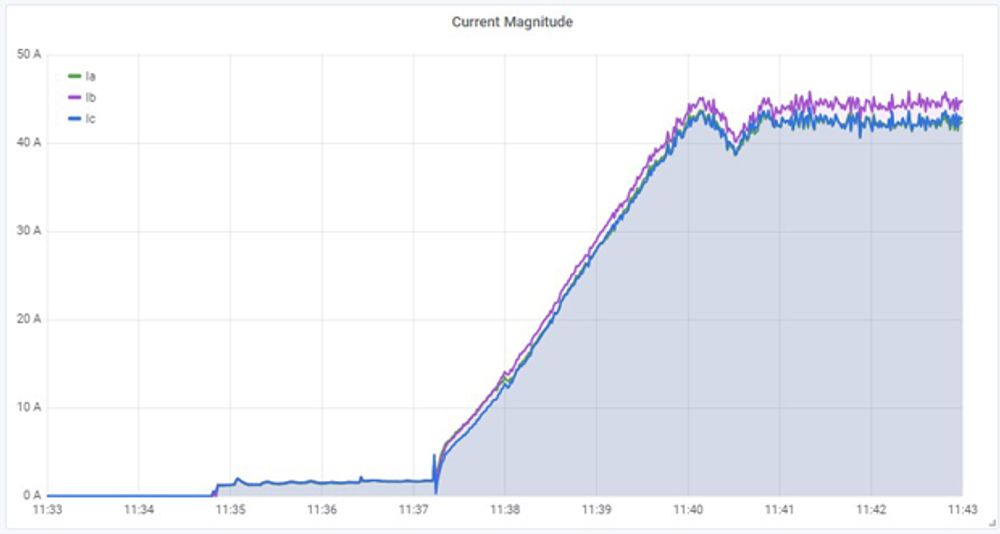
Synchrophasor data can also be used to develop accurate models for DERs and to characterise them precisely. This helps utilities to better understand the impact of DERs on their grids and be well prepared in dealing with them. For example, the current output of a DER that is connected to the grid via an RC-20 is depicted in figure 7. The synchrophasor data collected from this device shows that the generator takes around three minutes to reach its nominal current. These insights are not readily apparent from nameplate ratings, but detailed characterization from gathered PMU data allows utility engineers to have a comprehensive understanding of their asset system dynamics.
C. Power Quality
A further benefit of synchrophasor data is monitoring voltages and currents with a higher resolution. This helps to reveal and monitor sub-harmonics. For example, in the synchrophasor data collected from an industrial load connected to the medium voltage network via RC-20 shows a 5Hz resonance injected by the load. Sub-harmonic currents are components with frequencies lower than the system frequency (60 or 50 Hz). These components are caused by loads such as Arc Furnaces, Automated spot-welders, pulse burst-modulation power conditioned loads or Motor driving cyclic loads, such as forges, drop hammers, stamping tools, saws, compressors and reciprocating pumps [5].
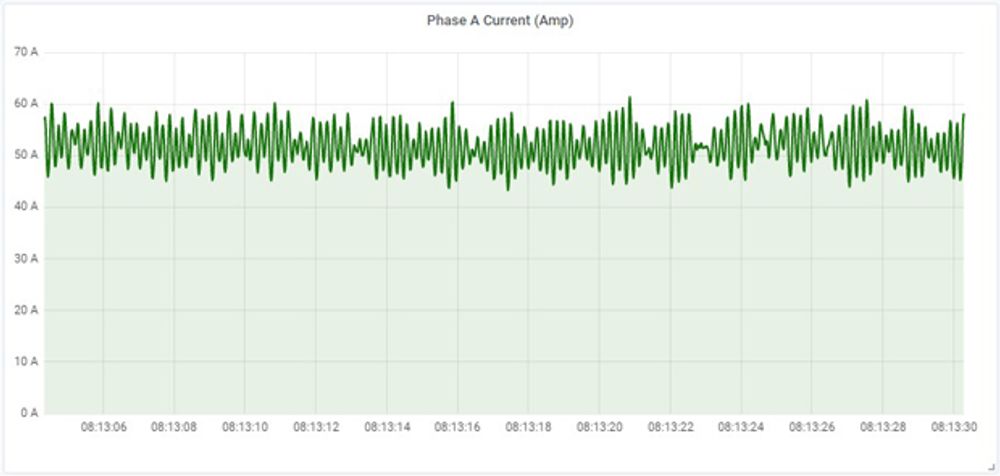
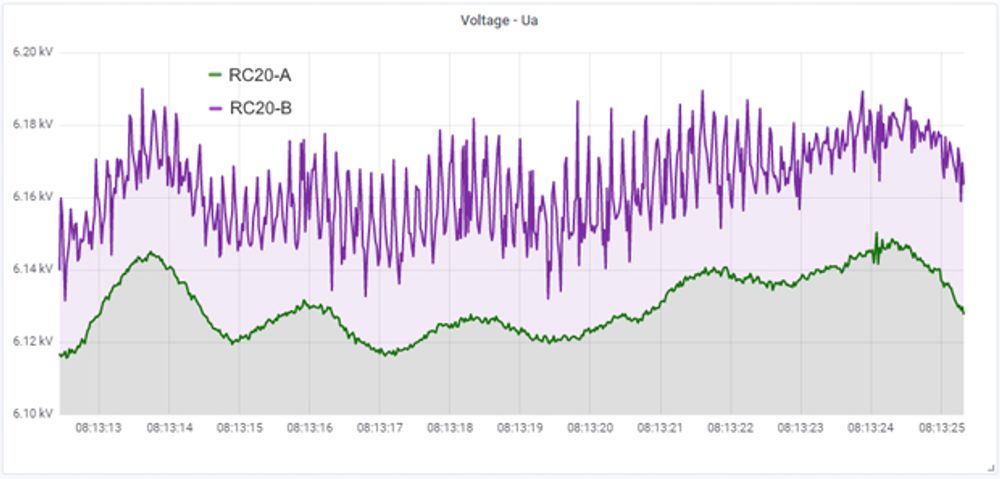
Figure 9 shows voltage magnitudes of two different locations. As it can be seen, RC-20-B which is in an area with a high penetration of rooftop solar PVs is reporting high voltage oscillations compared to another location (RC-20-A). These significant sustained voltage oscillations on the distribution system are not visible in the SCADA data. This example shows how synchrophasor data can provide enhanced situational awareness on the dynamic nature of the distribution system.
This low frequency current injection causes voltage modulation and visual flicker. It can also result in the saturation of power and measurement transformers, accelerating equipment degradation. Visibility of these issues through PMU data ensures users are aware of issues prior to equipment failure, so that cost effective preventative interventions can be applied.
D. Phase Identification
Synchrophasor data collected by RC-20s and presented in NOJA Power Analytics simplifies phase identification. Voltage phase angles of three RC-20s in a MV grid are illustrated in figure 10. It can be seen that voltage angles of RC-20-1 and RC-20-2 for all three phases are close to each other. However, Phase A and Phase C of RC-20-3 are different from the other two units by about 120 degrees. This indicates that what are labelled as Phase A and Phase C in the third RC-20 are reversed compared to the other two locations.
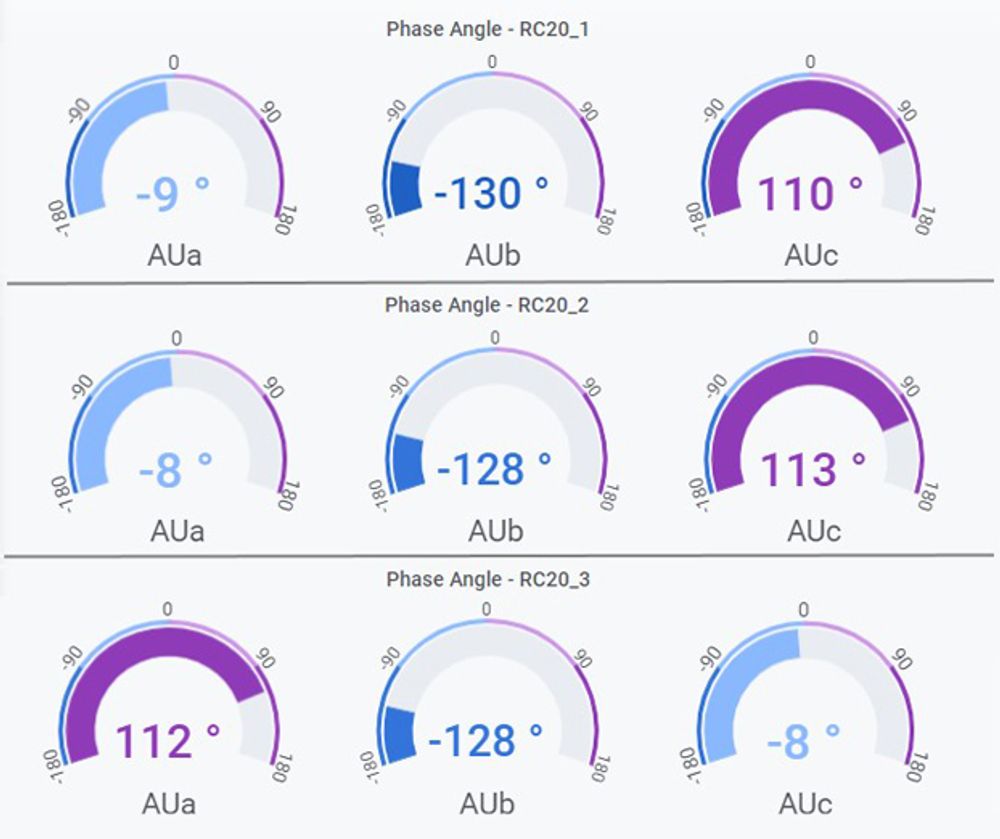
Incorrect phase identification can result in issues with load balance, fault location and targeting. Phase identification using NOJA Power Analytics helps with initial commissioning and ongoing monitoring to detect potential problems caused by unintentional changes to the phasing on one of the feeders.
E. Event Detection
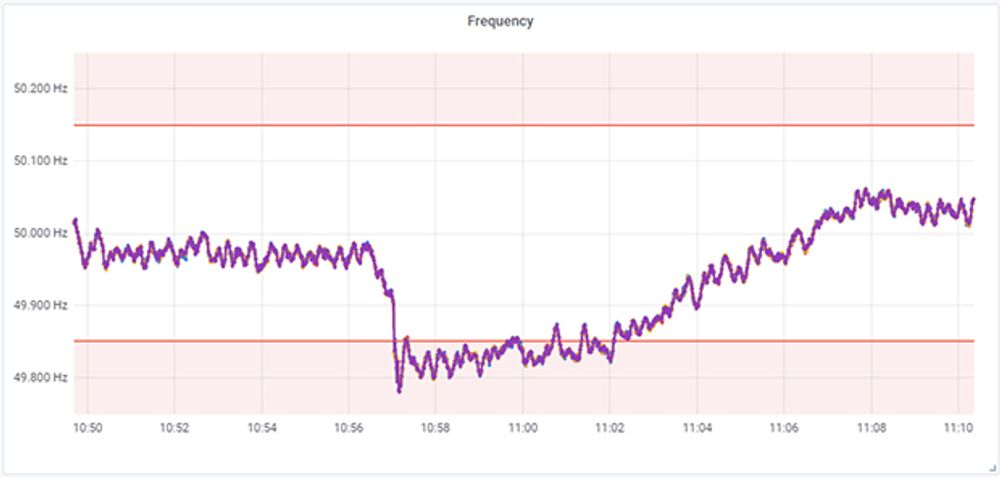
Network operators can use NOJA Power Analysis platform to setup alerts and thresholds for measured power system data. The alerting system will notify operators when values are outside the defined limits. For instance, figure 11 shows an incident on the 13th of January 2021 around 10:57, when frequency dropped below the defined threshold (49.85Hz). Based on the Australian Energy Market Operator data [5] this frequency drop in the network was caused by simultaneous trip of two generation units at a generation station in Australia.
F. Post Fault Analysis
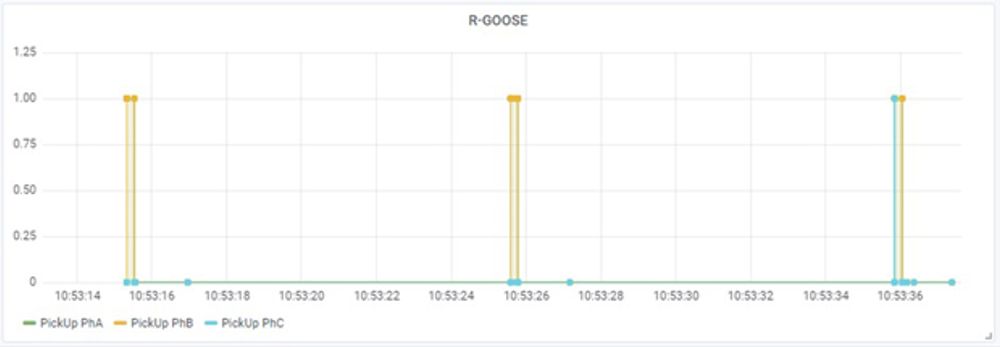
Synchrophasor data are very useful in analysing faults and study their causes and their impacts on the network. NOJA Power Analytics, in addition to synchrophasor data provides operators with event data (R-GOOSE). When a fault happens, RC-20 sends R-GOOSE data which indicates the status of the switch, protection functions and their recorded values at the time of the event. This information is additional to the synchrophasor values that are reported continuously and makes the fault analysis much easier.
Figure 12 illustrates synchrophasor data that were collected during a reclosing action of an RC-20 in MV grid. From this data it can be seen that the fault started on phase B of the load side and then became a three-phase permanent fault which caused the recloser to stay open and disconnect the load from the grid.
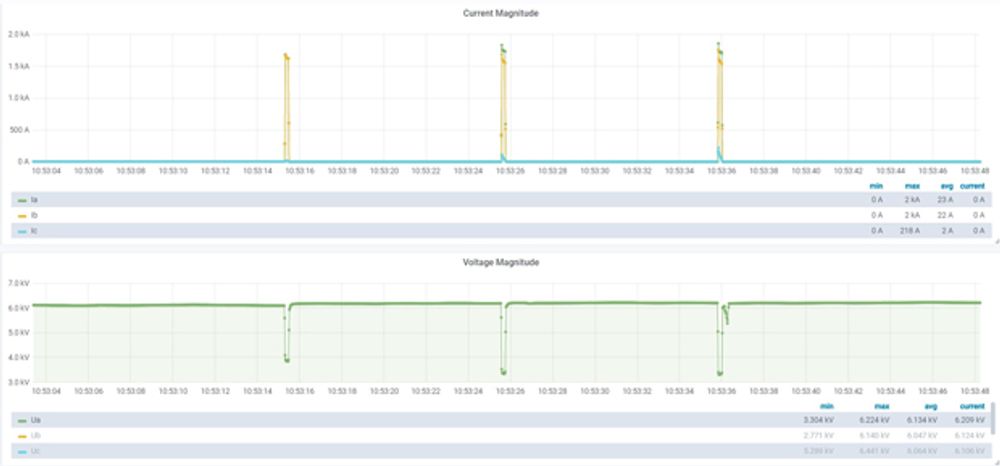
Figure 13 presents R-GOOSE data collected from the same device at the time of this event. From this additional information it can be concluded that first the overcurrent protection at phase B had tripped and in the second reclosing Earth Fault protection and overcurrent protection on phase B and A were activated. At the final reclosing the over current fault still existed and caused EF and OC trips on all three phases.
Conclusion
The preliminary findings of distribution network applications for PMU technology are promising. The benefits for safe and reliable integration of renewable energy is clear, demonstrated through the load analysis, DER characterization and Power quality monitoring capabilities. PMU data is also essential for wide-area stability protection schemes, which present an interesting option for further research and application.
The data acquired through this ARENA project remains under analysis by universities for fault characterisation and network analysis. Whilst these initial results justify the program investment, further rewards in network analysis are to be gained from implementation of data analysis algorithms currently under development.
Acknowledgment
This Activity received funding from the Australian Renewable Energy Agency (ARENA) as part of ARENA's Advancing Renewables Programme.
References
- IEC, IEC/IEEE 60255-118-1:2018 - Measuring relays and protection equipment - Part 118-1: Synchrophasor for Power Systems. 2018.
- I. P. & E. Society, IEEE Std C37.118.2TM-2011: IEEE Standard for Synchrophasor Data Transfer for Power Systems, vol. 2011, no. December. 2011.
- A. Von Meier et al., “Synchrophasor Monitoring for Distribution Systems : Technical Foundations and Applications A White Paper by the NASPI Distribution Task Team,” no. January, pp. 1–62, 2018.
- AEMO Market Notice 13 January 2021, https://aemo.com.au/market-notices, Accessed on 5/2/2021
- M. Peterson, P. E. R. Midence, P. E. J. Perez and P. E. A. Mulawarman, "Application of a subharmonic protection relay," 11th IET International Conference on Developments in Power Systems Protection (DPSP 2012), Birmingham, UK, 2012, pp. 1-6, doi: 10.1049/cp.2012.0022.
Quisiera recibir actualizaciones respecto a la tecnología para redes eléctricas de distribución?
Únase a nuestro boletín técnico semanal gratuito, en el cual compartimos nuestra experiencia en ingeniería eléctrica global directamente en su correo electrónico
Suscribirse →